I wasn’t trying to optimize anything. I was testing a variable because I was curious what would happen.

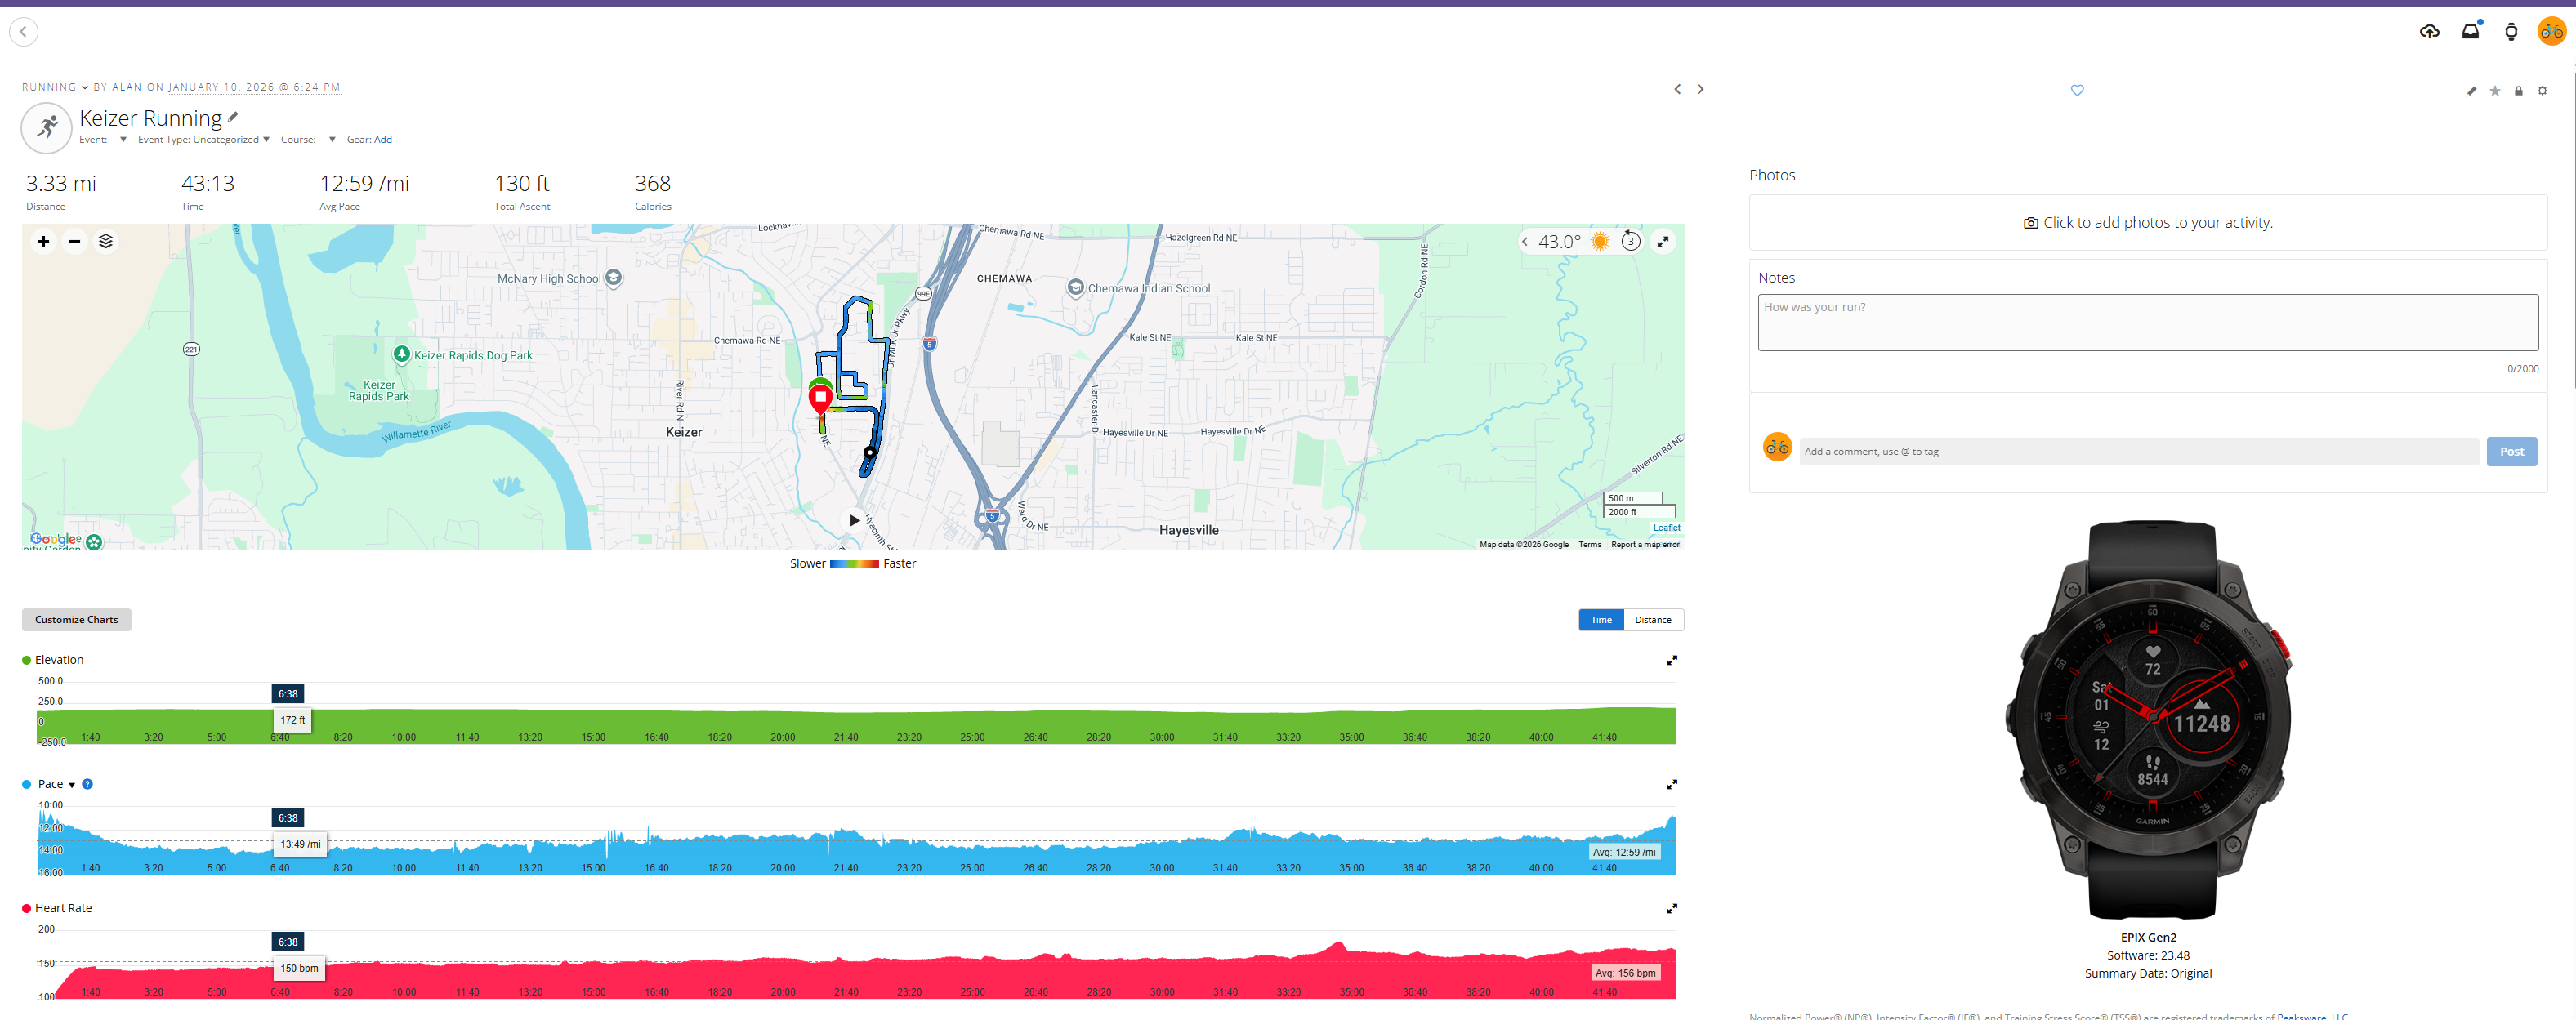
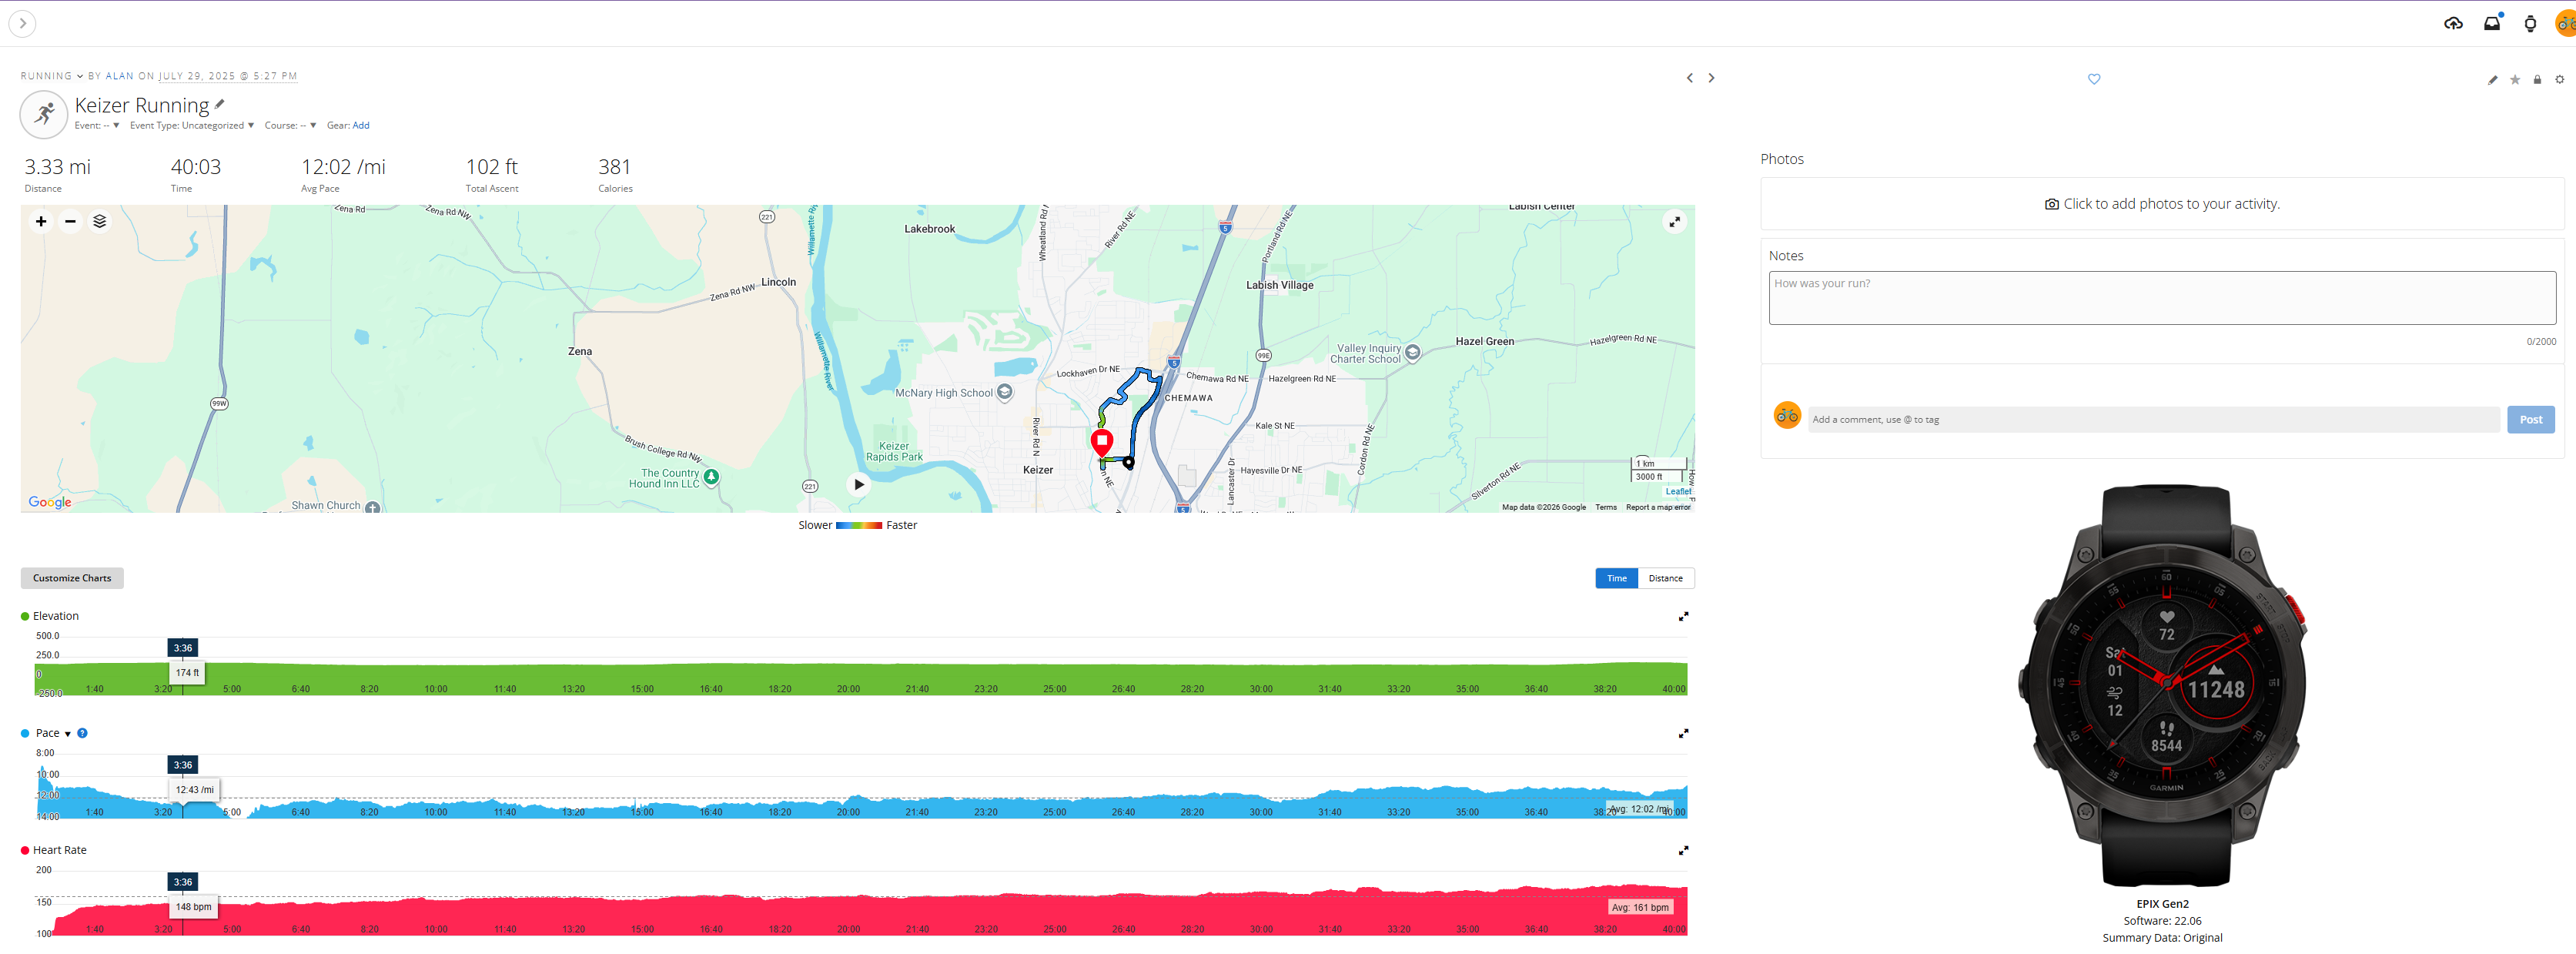
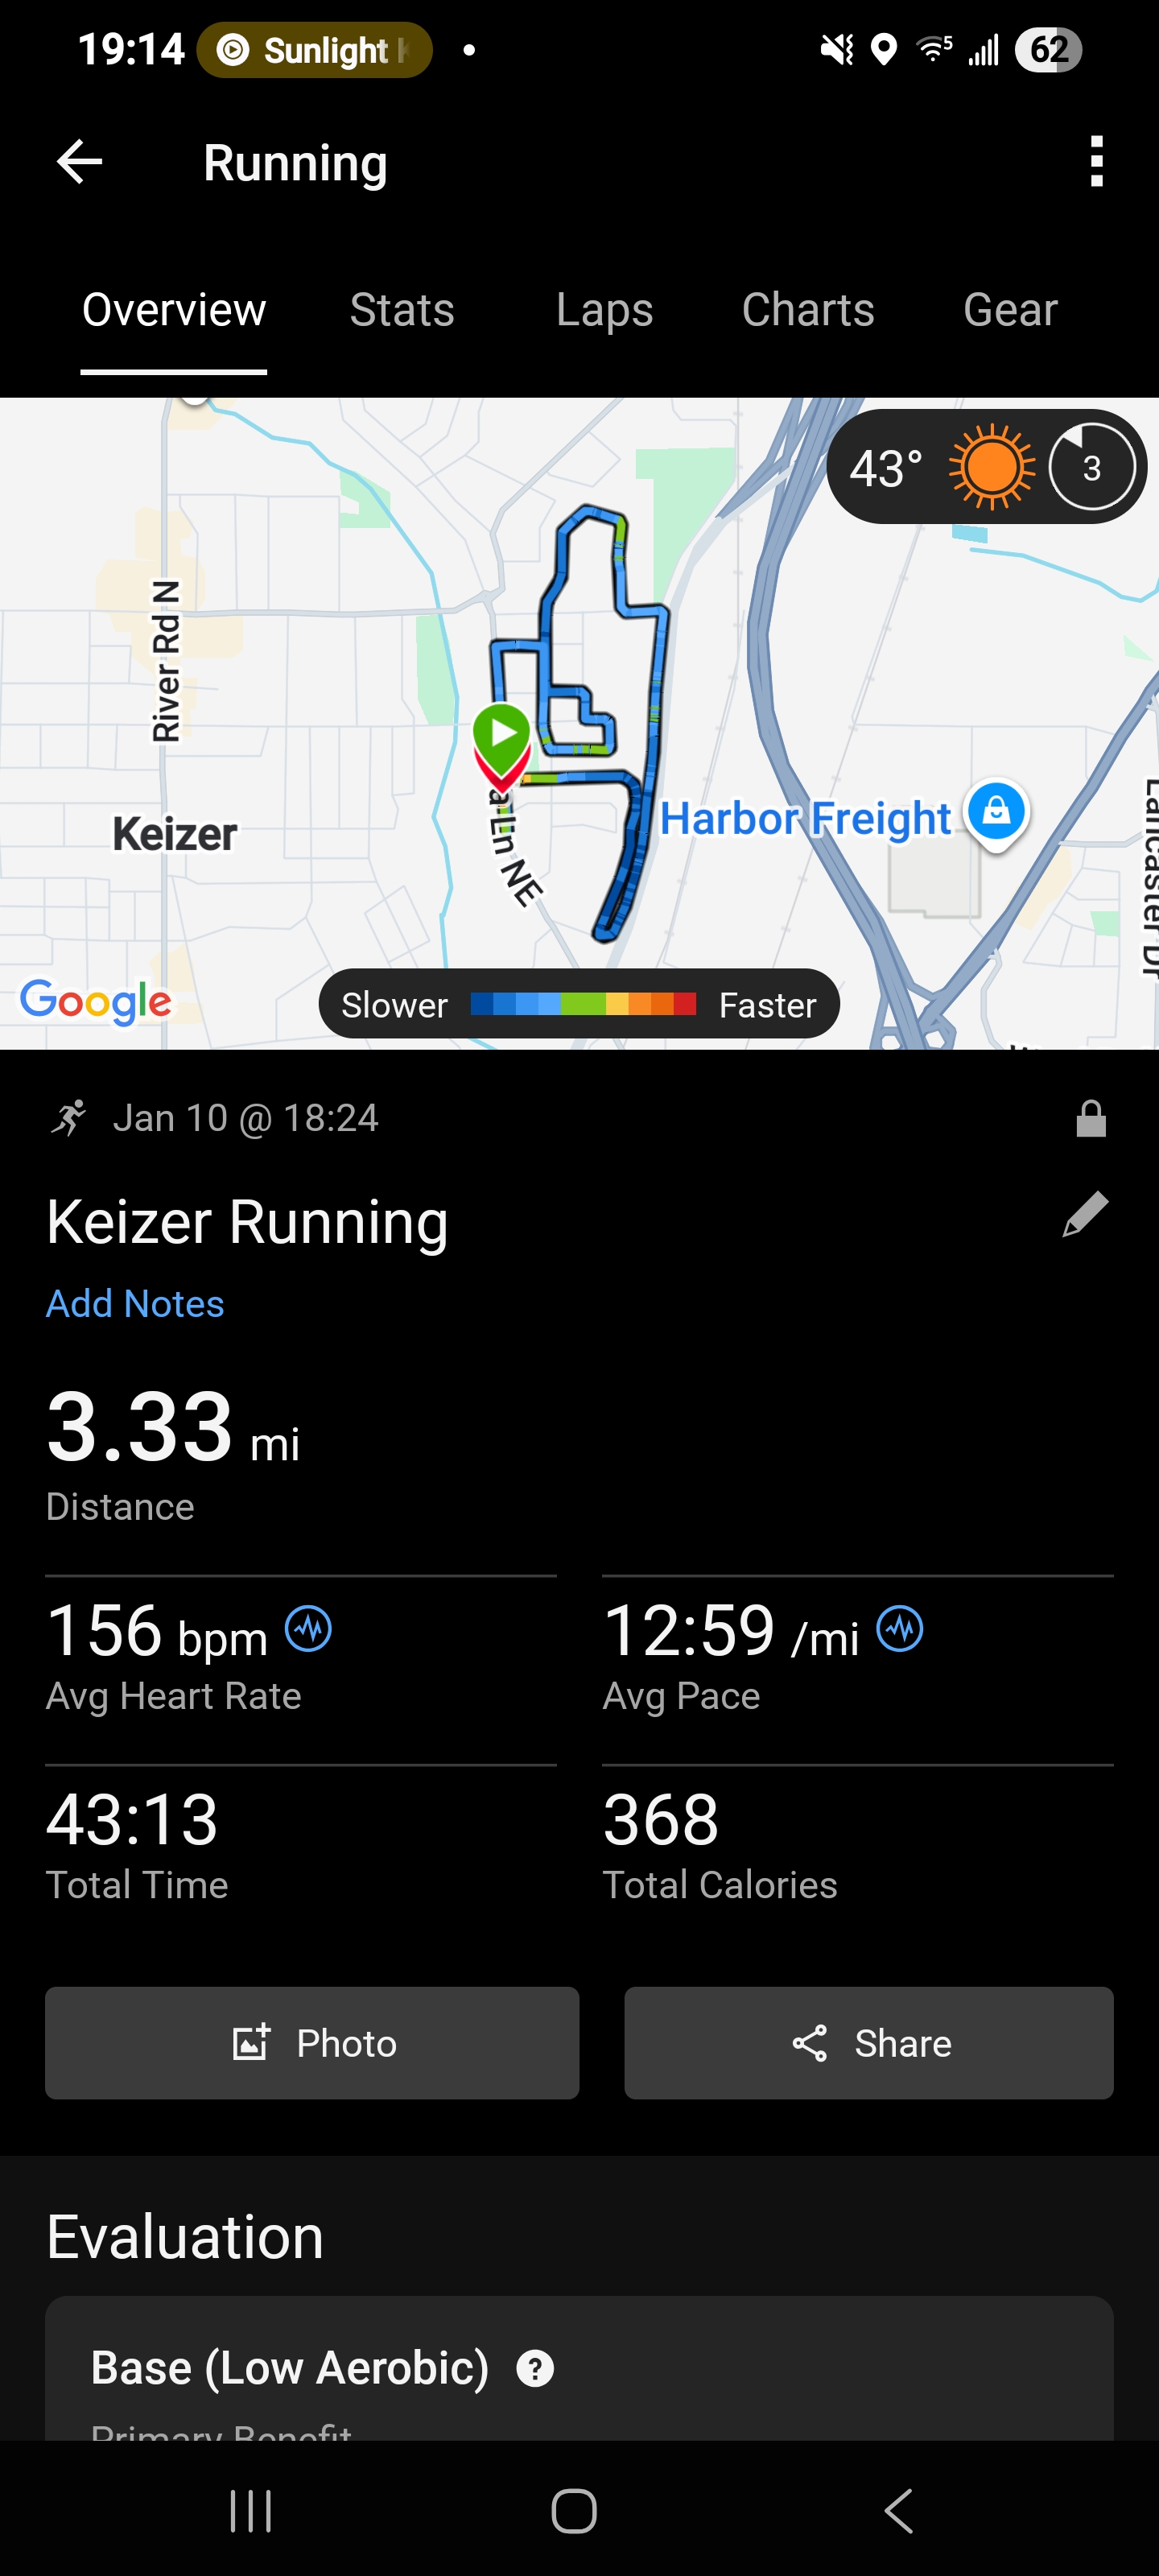
Keizer Running - January 10, 2025
3.33 miles | 156 bpm avg | 12:59/mi pace | 43:13 total time
Here’s what I consumed in the 70 minutes before stepping out the door:
- 5:00 PM: 24oz coffee (roughly 280mg caffeine)
- 5:55 PM: 16oz Ghost energy drink (200mg caffeine)
- 6:10 PM: 20oz Body Armor LYTE (electrolytes, no caffeine)
- 6:15 PM: Started running
The Liquid Stack
The “Fuck Around and Find Out” Protocol
Total liquid volume: ~60 ounces (roughly 2.5 pounds). Total fucks given about optimal hydration timing: Zero.
This wasn’t a carefully designed protocol. I knew I was doing a recovery run and wasn’t going to bail, so the liquid became a “let’s see what the fuck happens” variable.
The Evidence: Data Evolution
(Tap any chart below to open full resolution and zoom in)
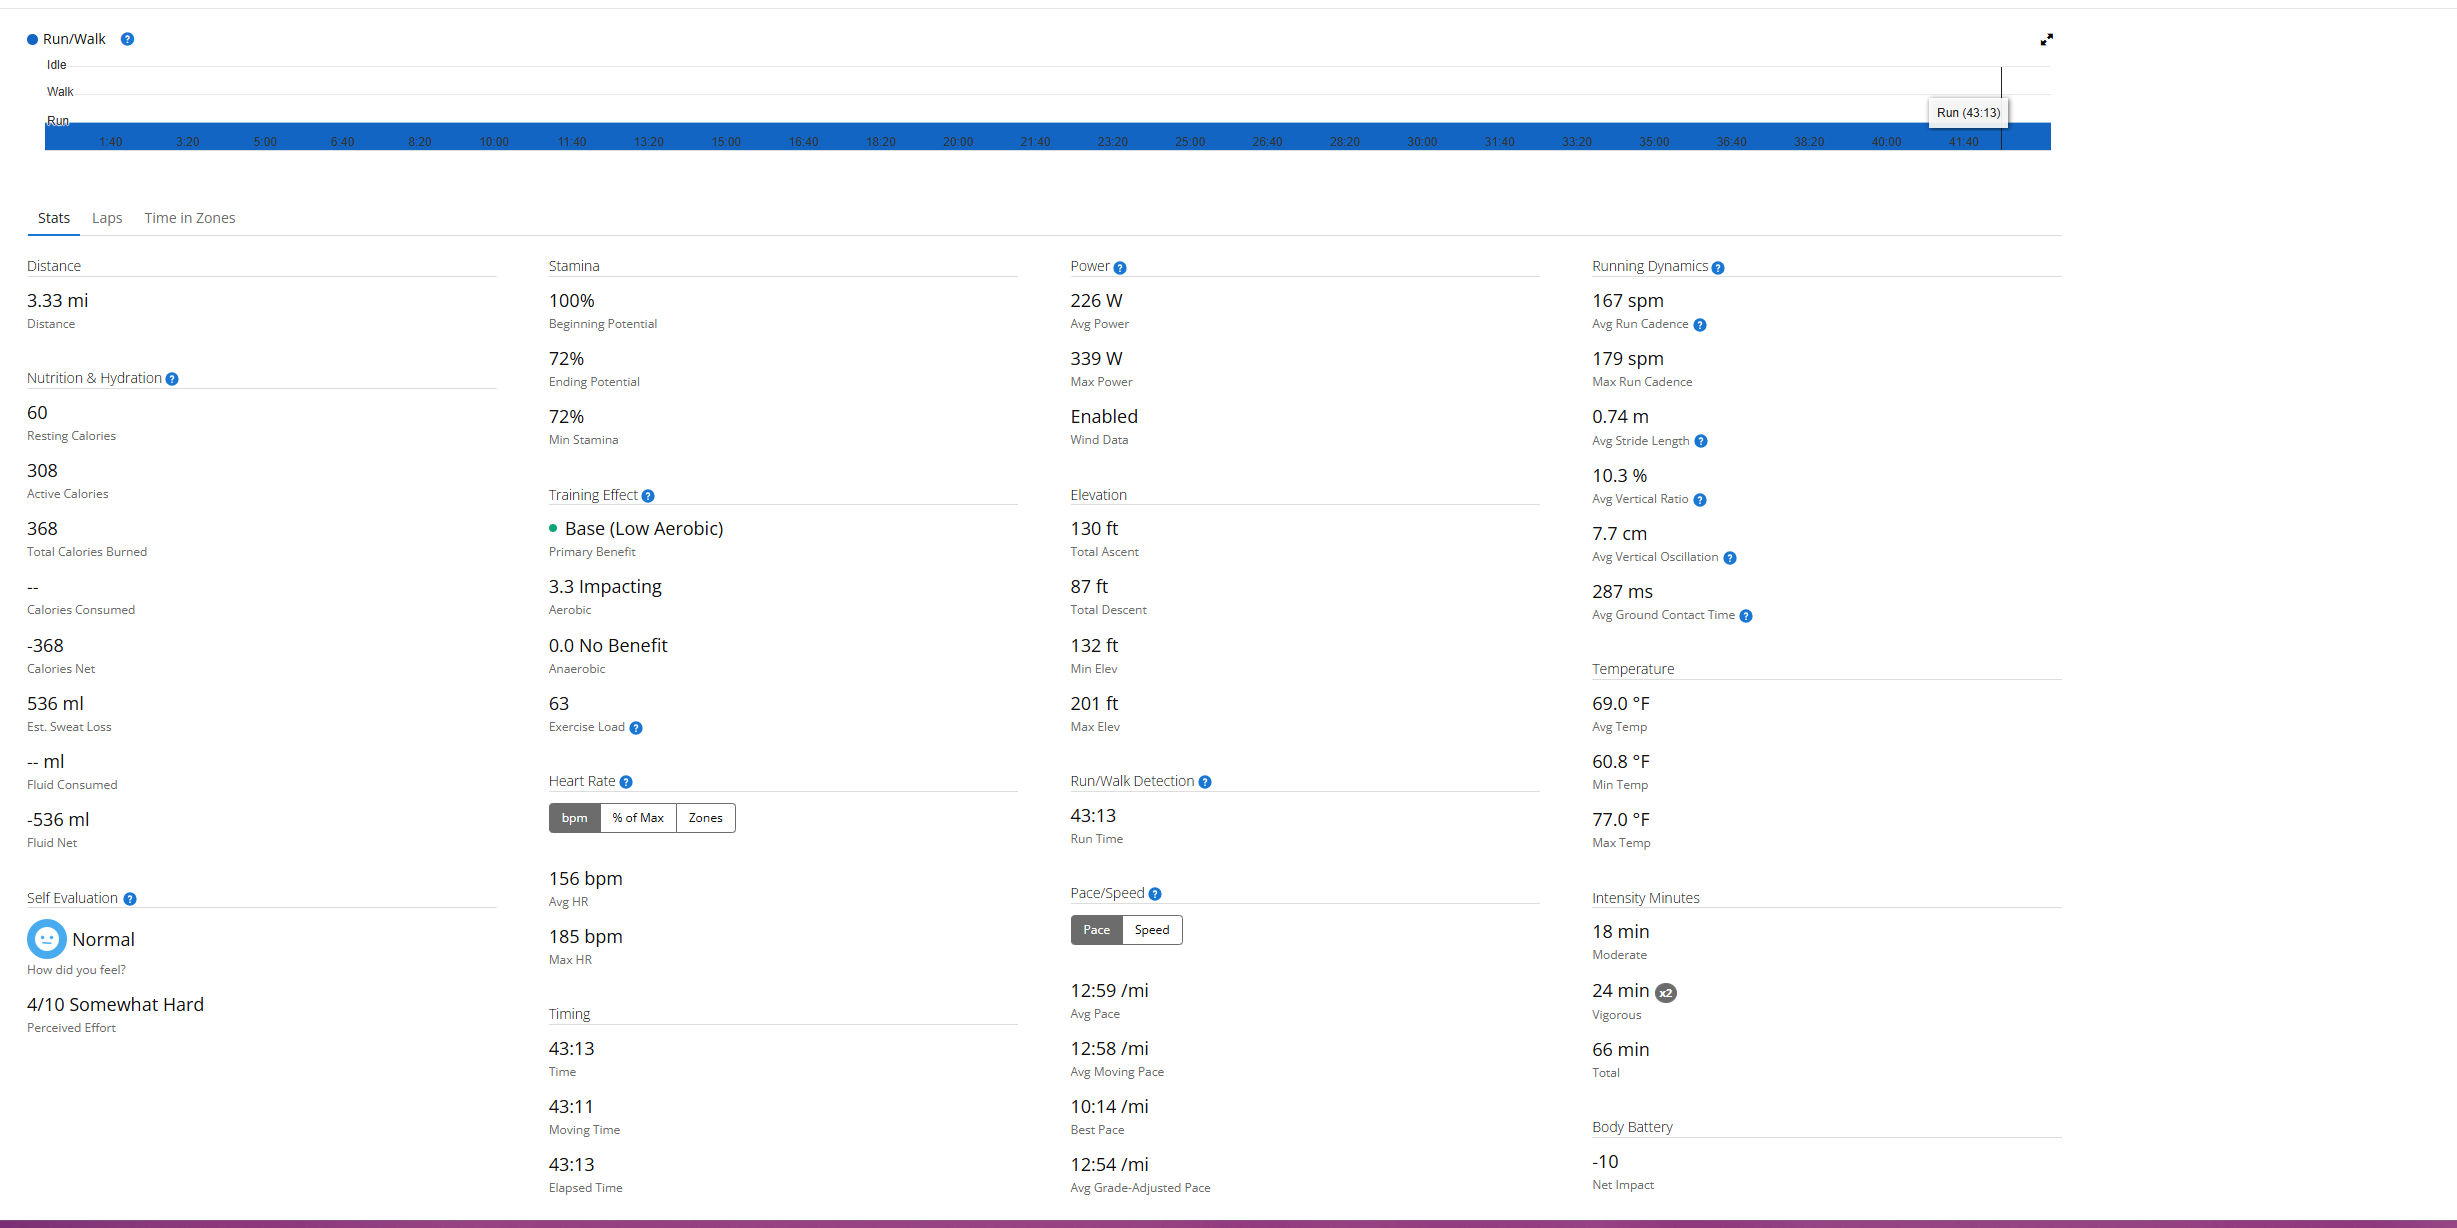
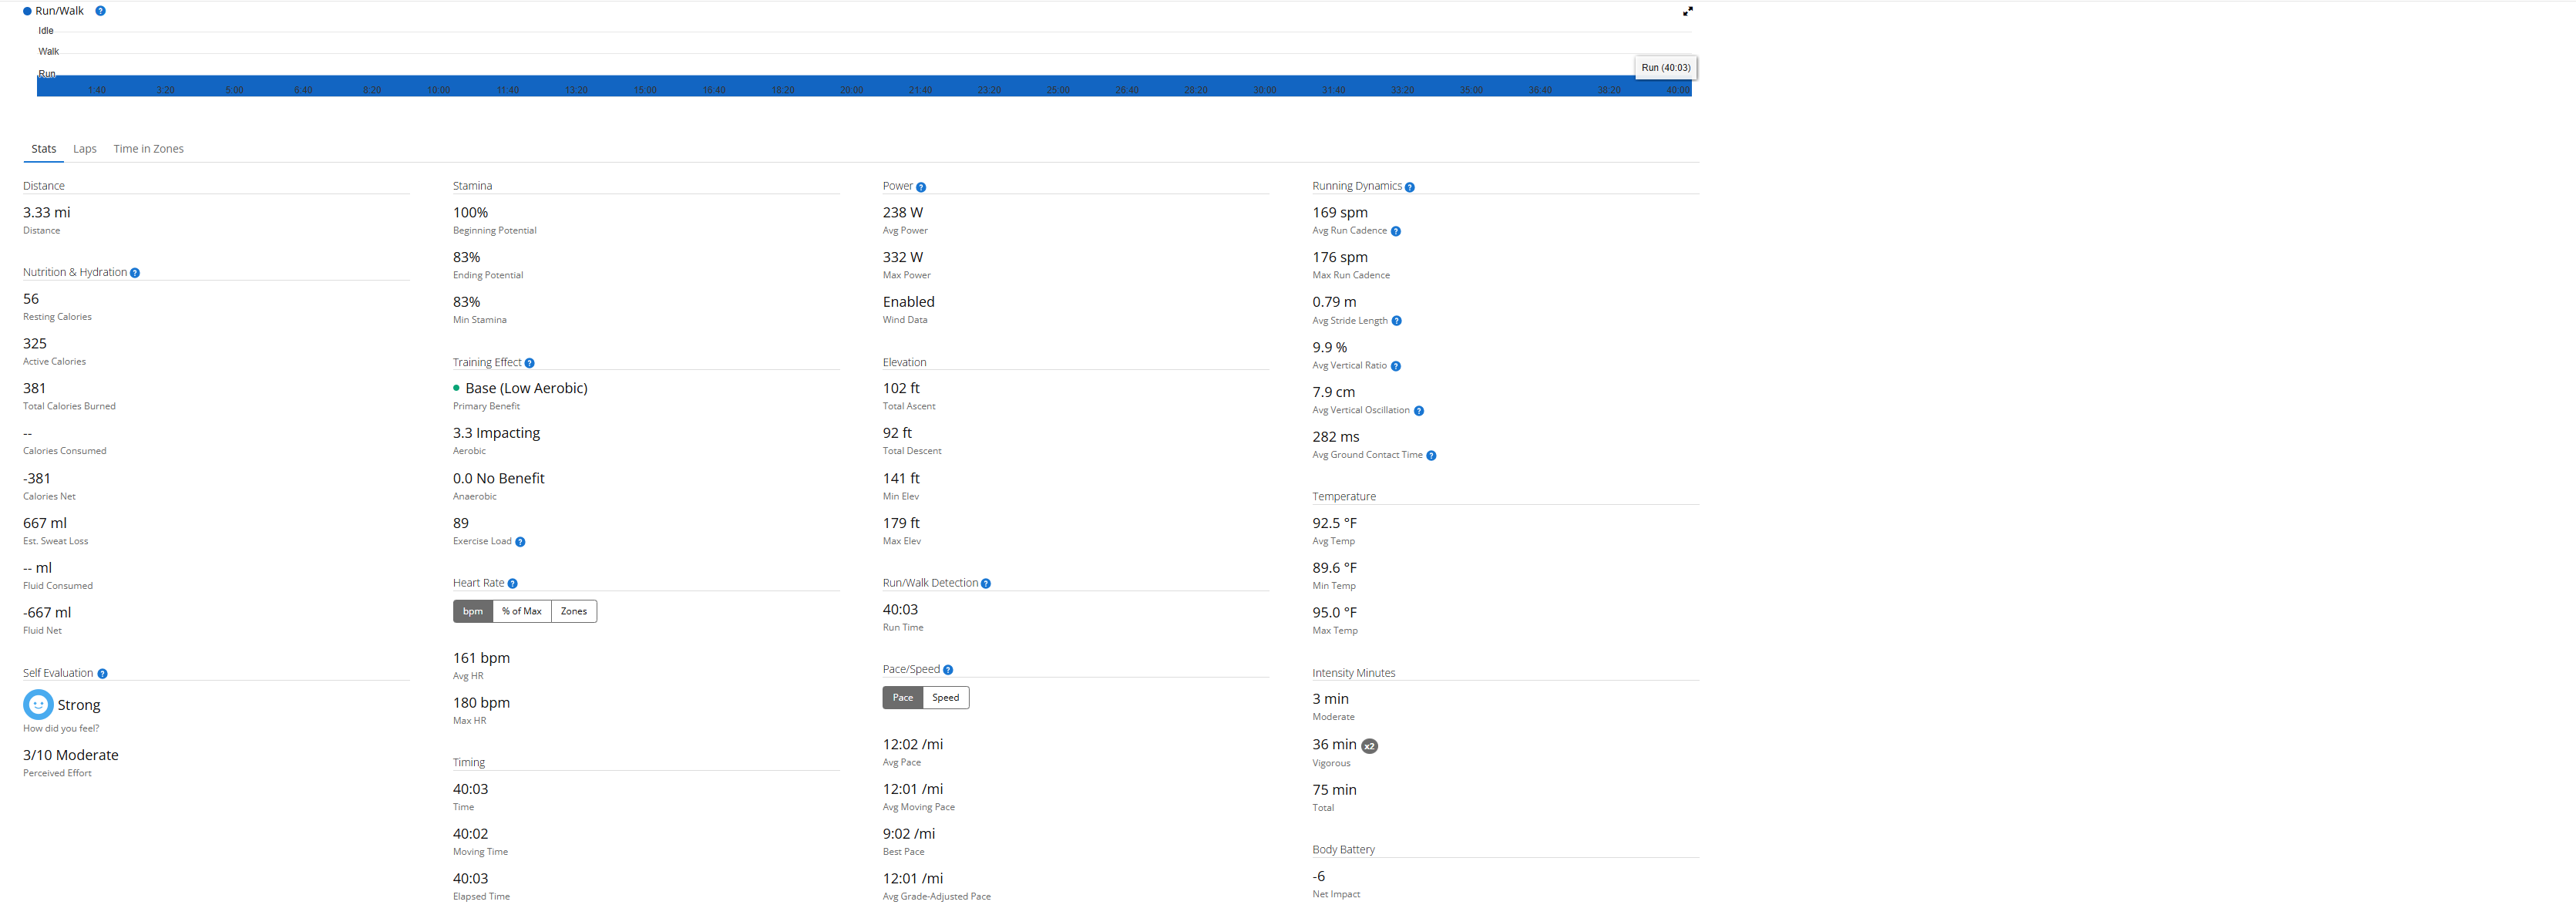
Row 1: Heart Rate & Pace Analysis
Row 2: Training Effect & Impact
Row 3: Zone Distribution
Expected vs. Reality
What I expected: To feel like I was sloshing around with a water balloon in my stomach. Maybe some gastric distress. Definitely uncomfortable.
What actually happened: I felt MORE bloated than baseline, but it wasn’t overly uncomfortable during the run itself. My perceived effort stayed normal for a recovery run. The metrics backed this up.
The real surprise came the SECOND I stopped running. I had a virtually uncontrollable need to pee. I didn’t even make it to the house - thank god it was dark and I had my Camry to block me.
What The Data Actually Shows
Here’s what’s fascinating when you look at these side-by-side:
The liquid loading didn’t destroy my performance relative to my current fitness level. Yes, I was 4+ minutes per mile slower on January 10th - but that’s not because of the liquid. That’s because I’m detrained.
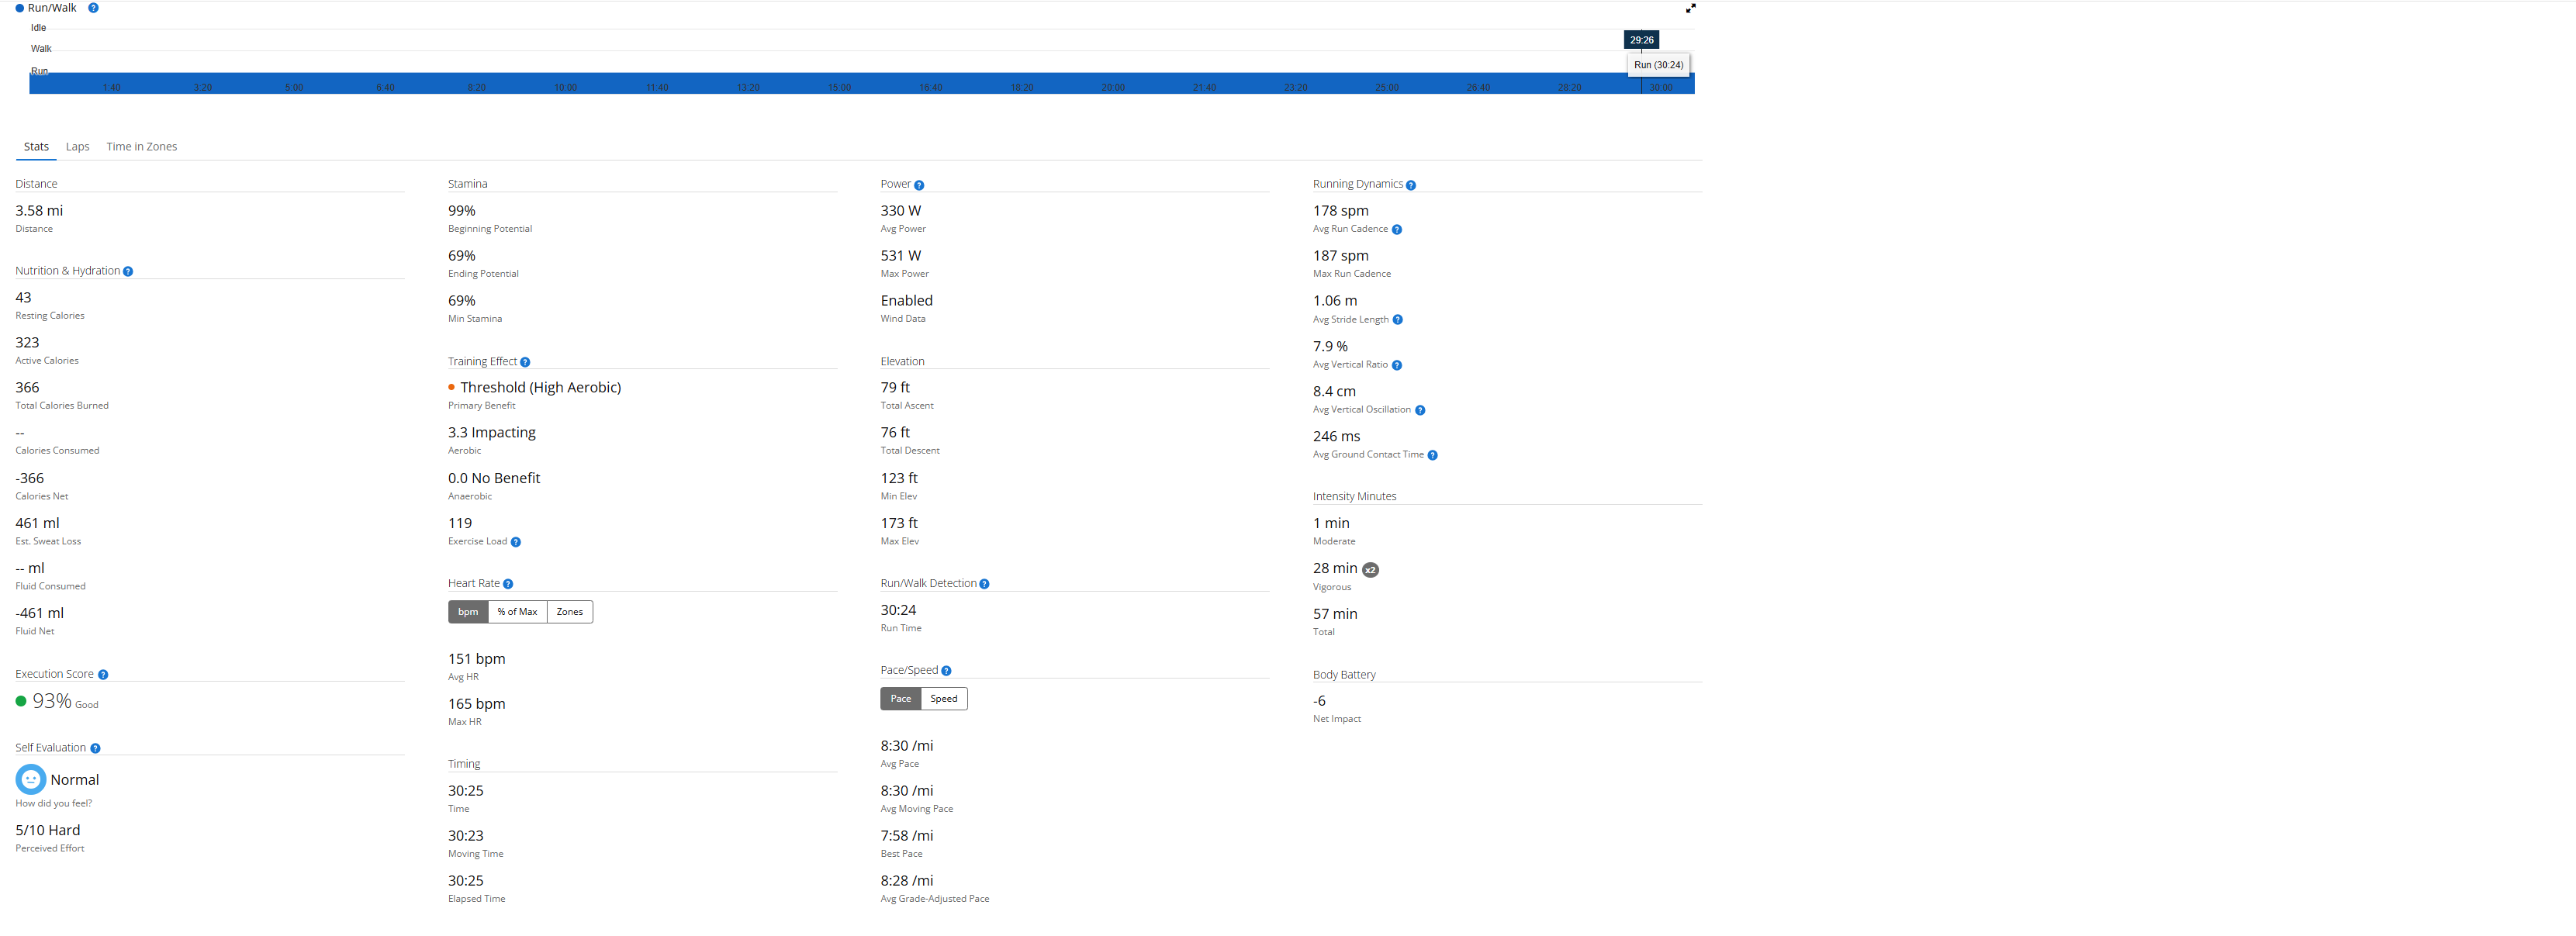
Look at the heart rate data:
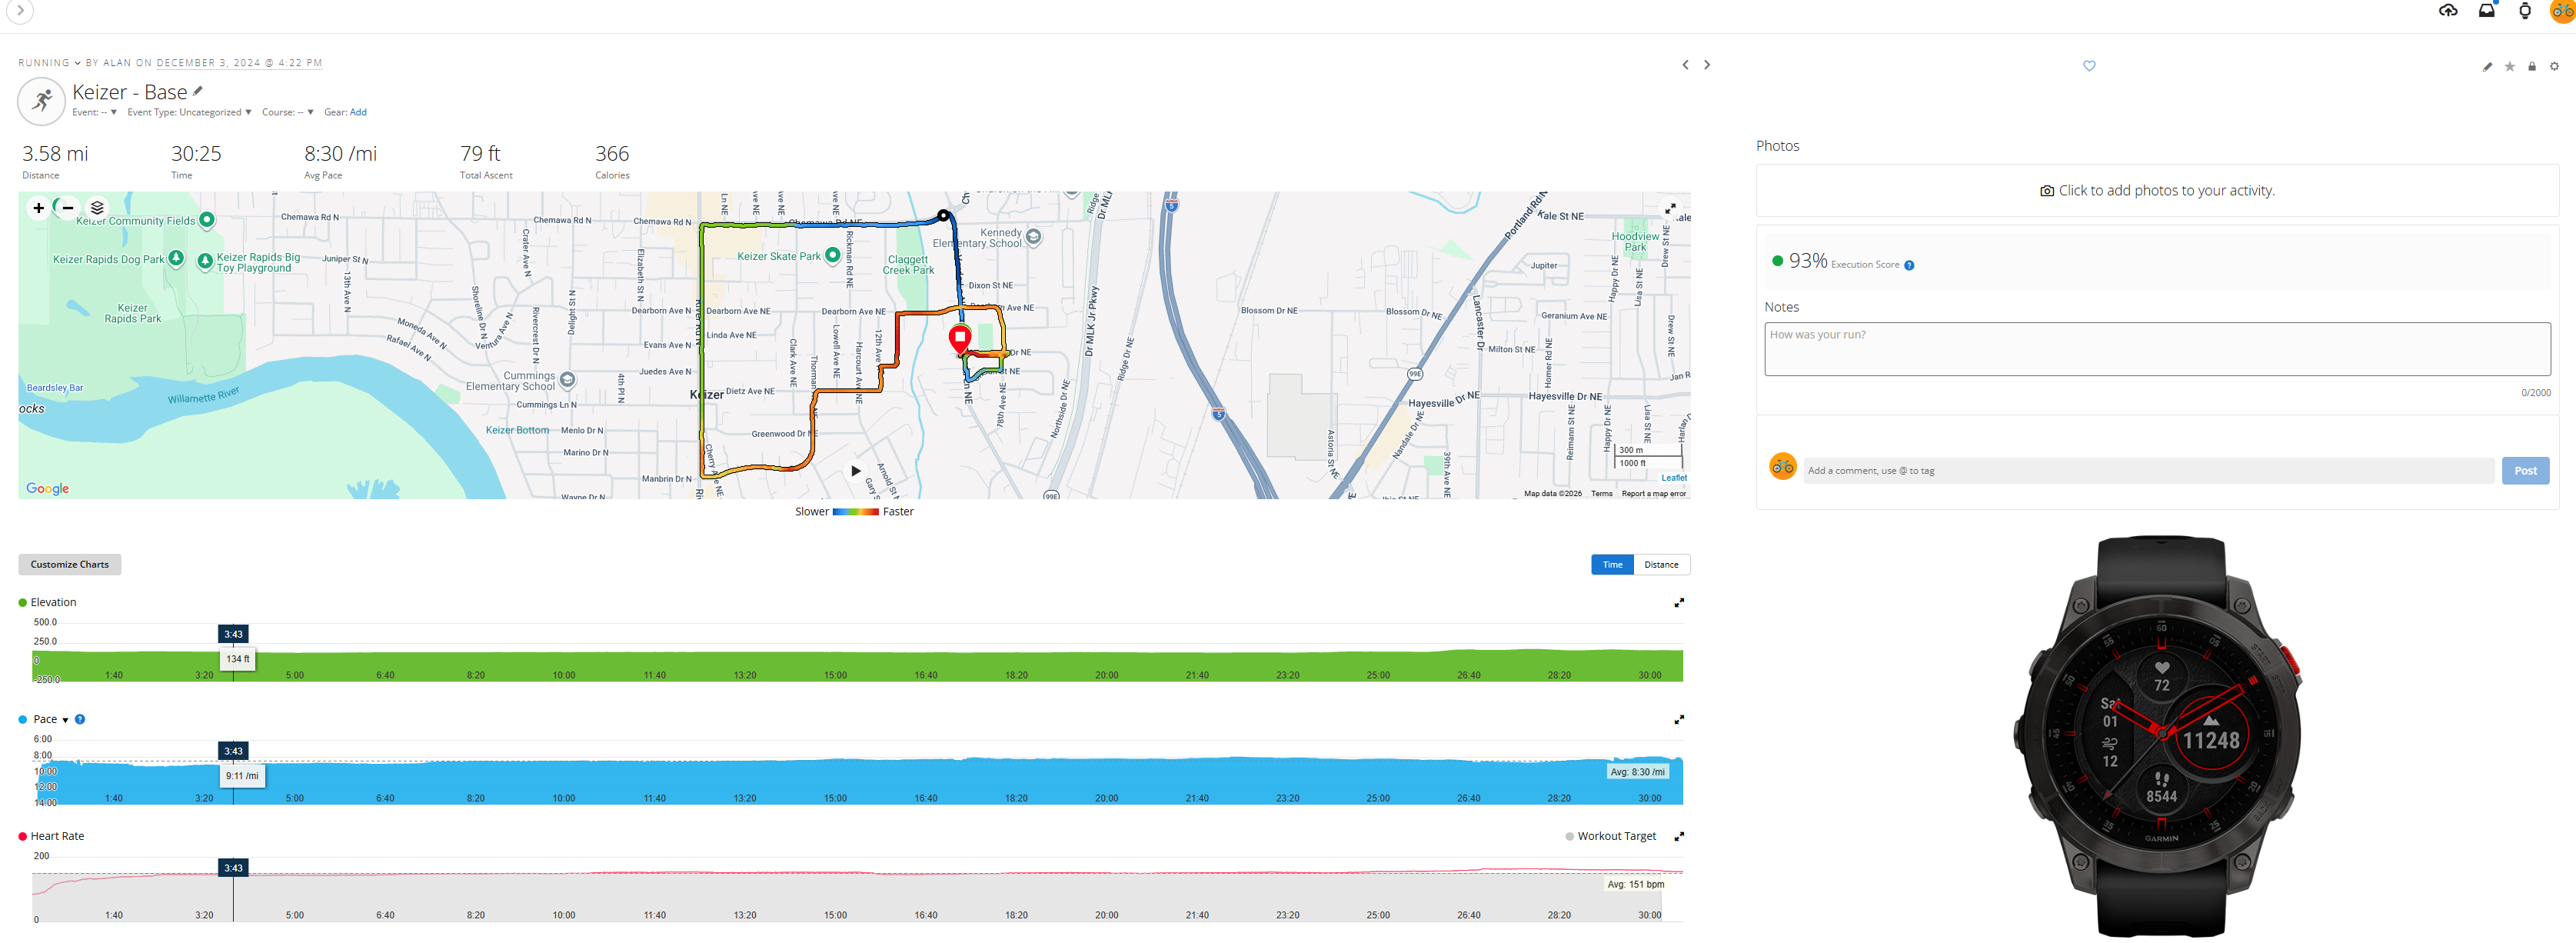
- Dec 9 (conditioned): 151 bpm avg at 8:30/mi pace
- Jan 10 (detrained + liquid): 156 bpm avg at 12:59/mi pace
My heart rate was only 5 bpm higher on average despite carrying 2.5 pounds of liquid and running at a much slower pace. That tells me the liquid loading was manageable for my cardiovascular system at recovery effort.
Visual Log: Vitals & Aftermath
Tracking isn’t just about the run. It’s about the systemic impact.
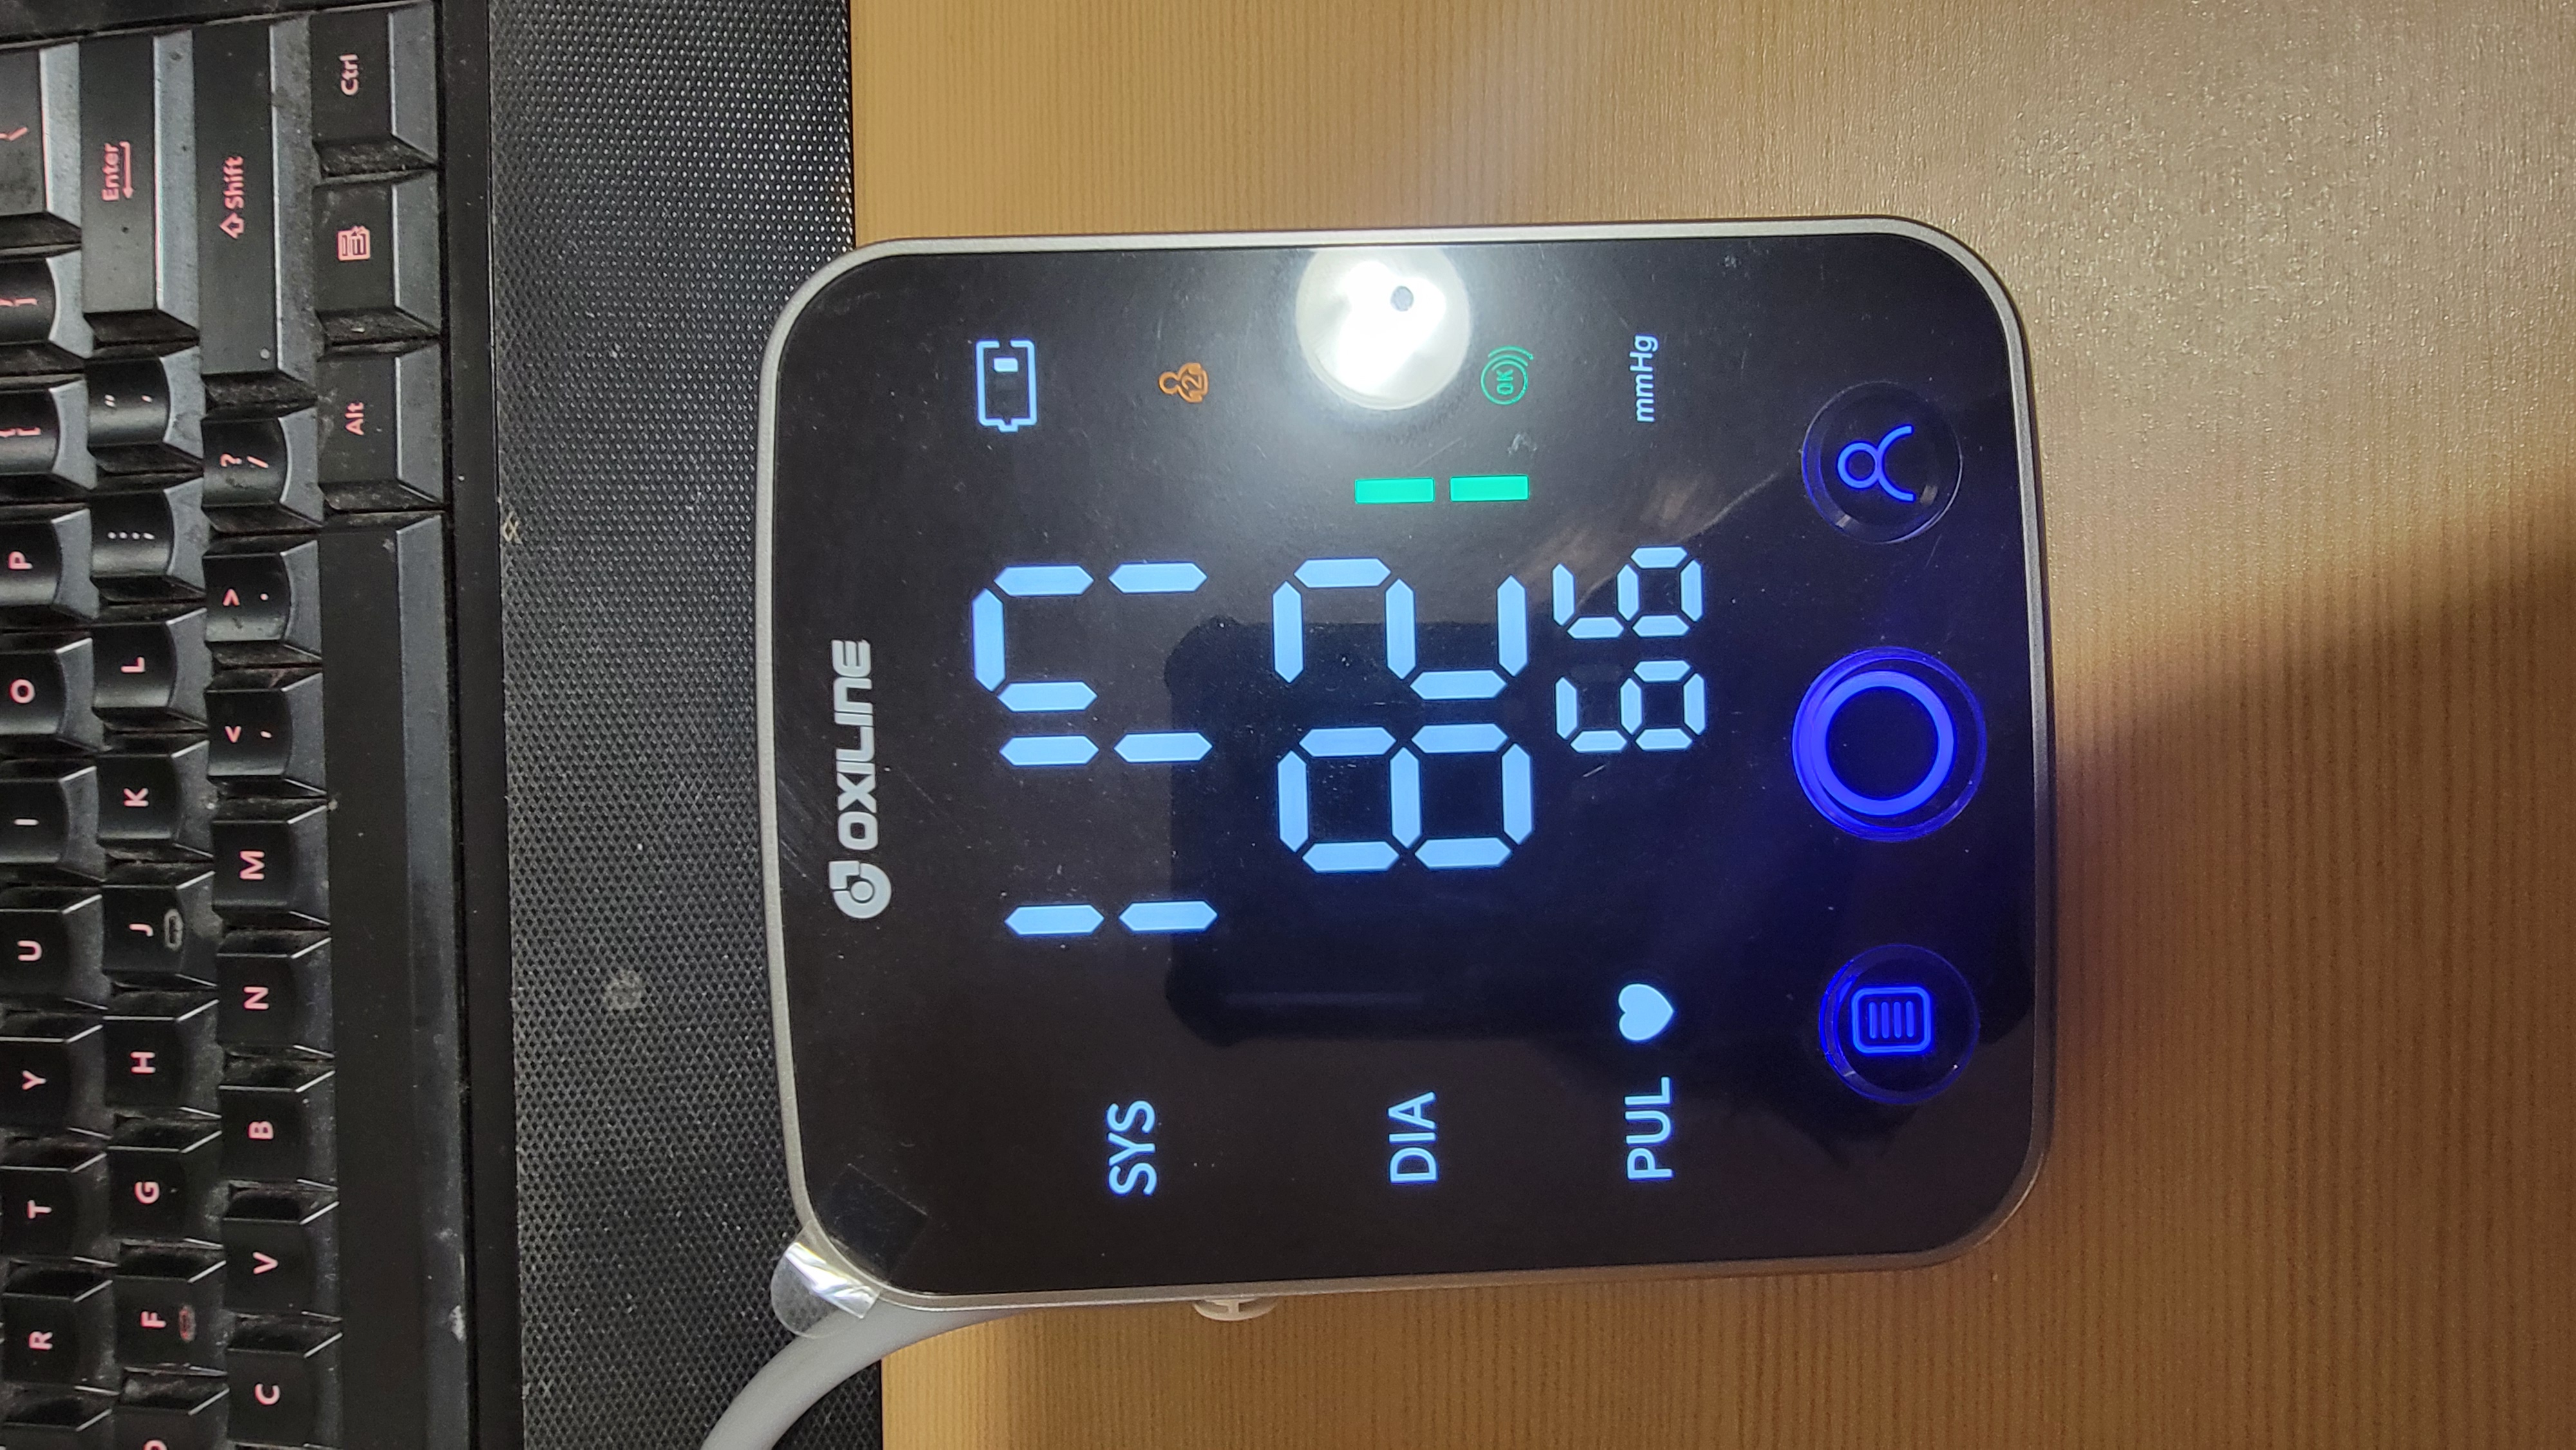
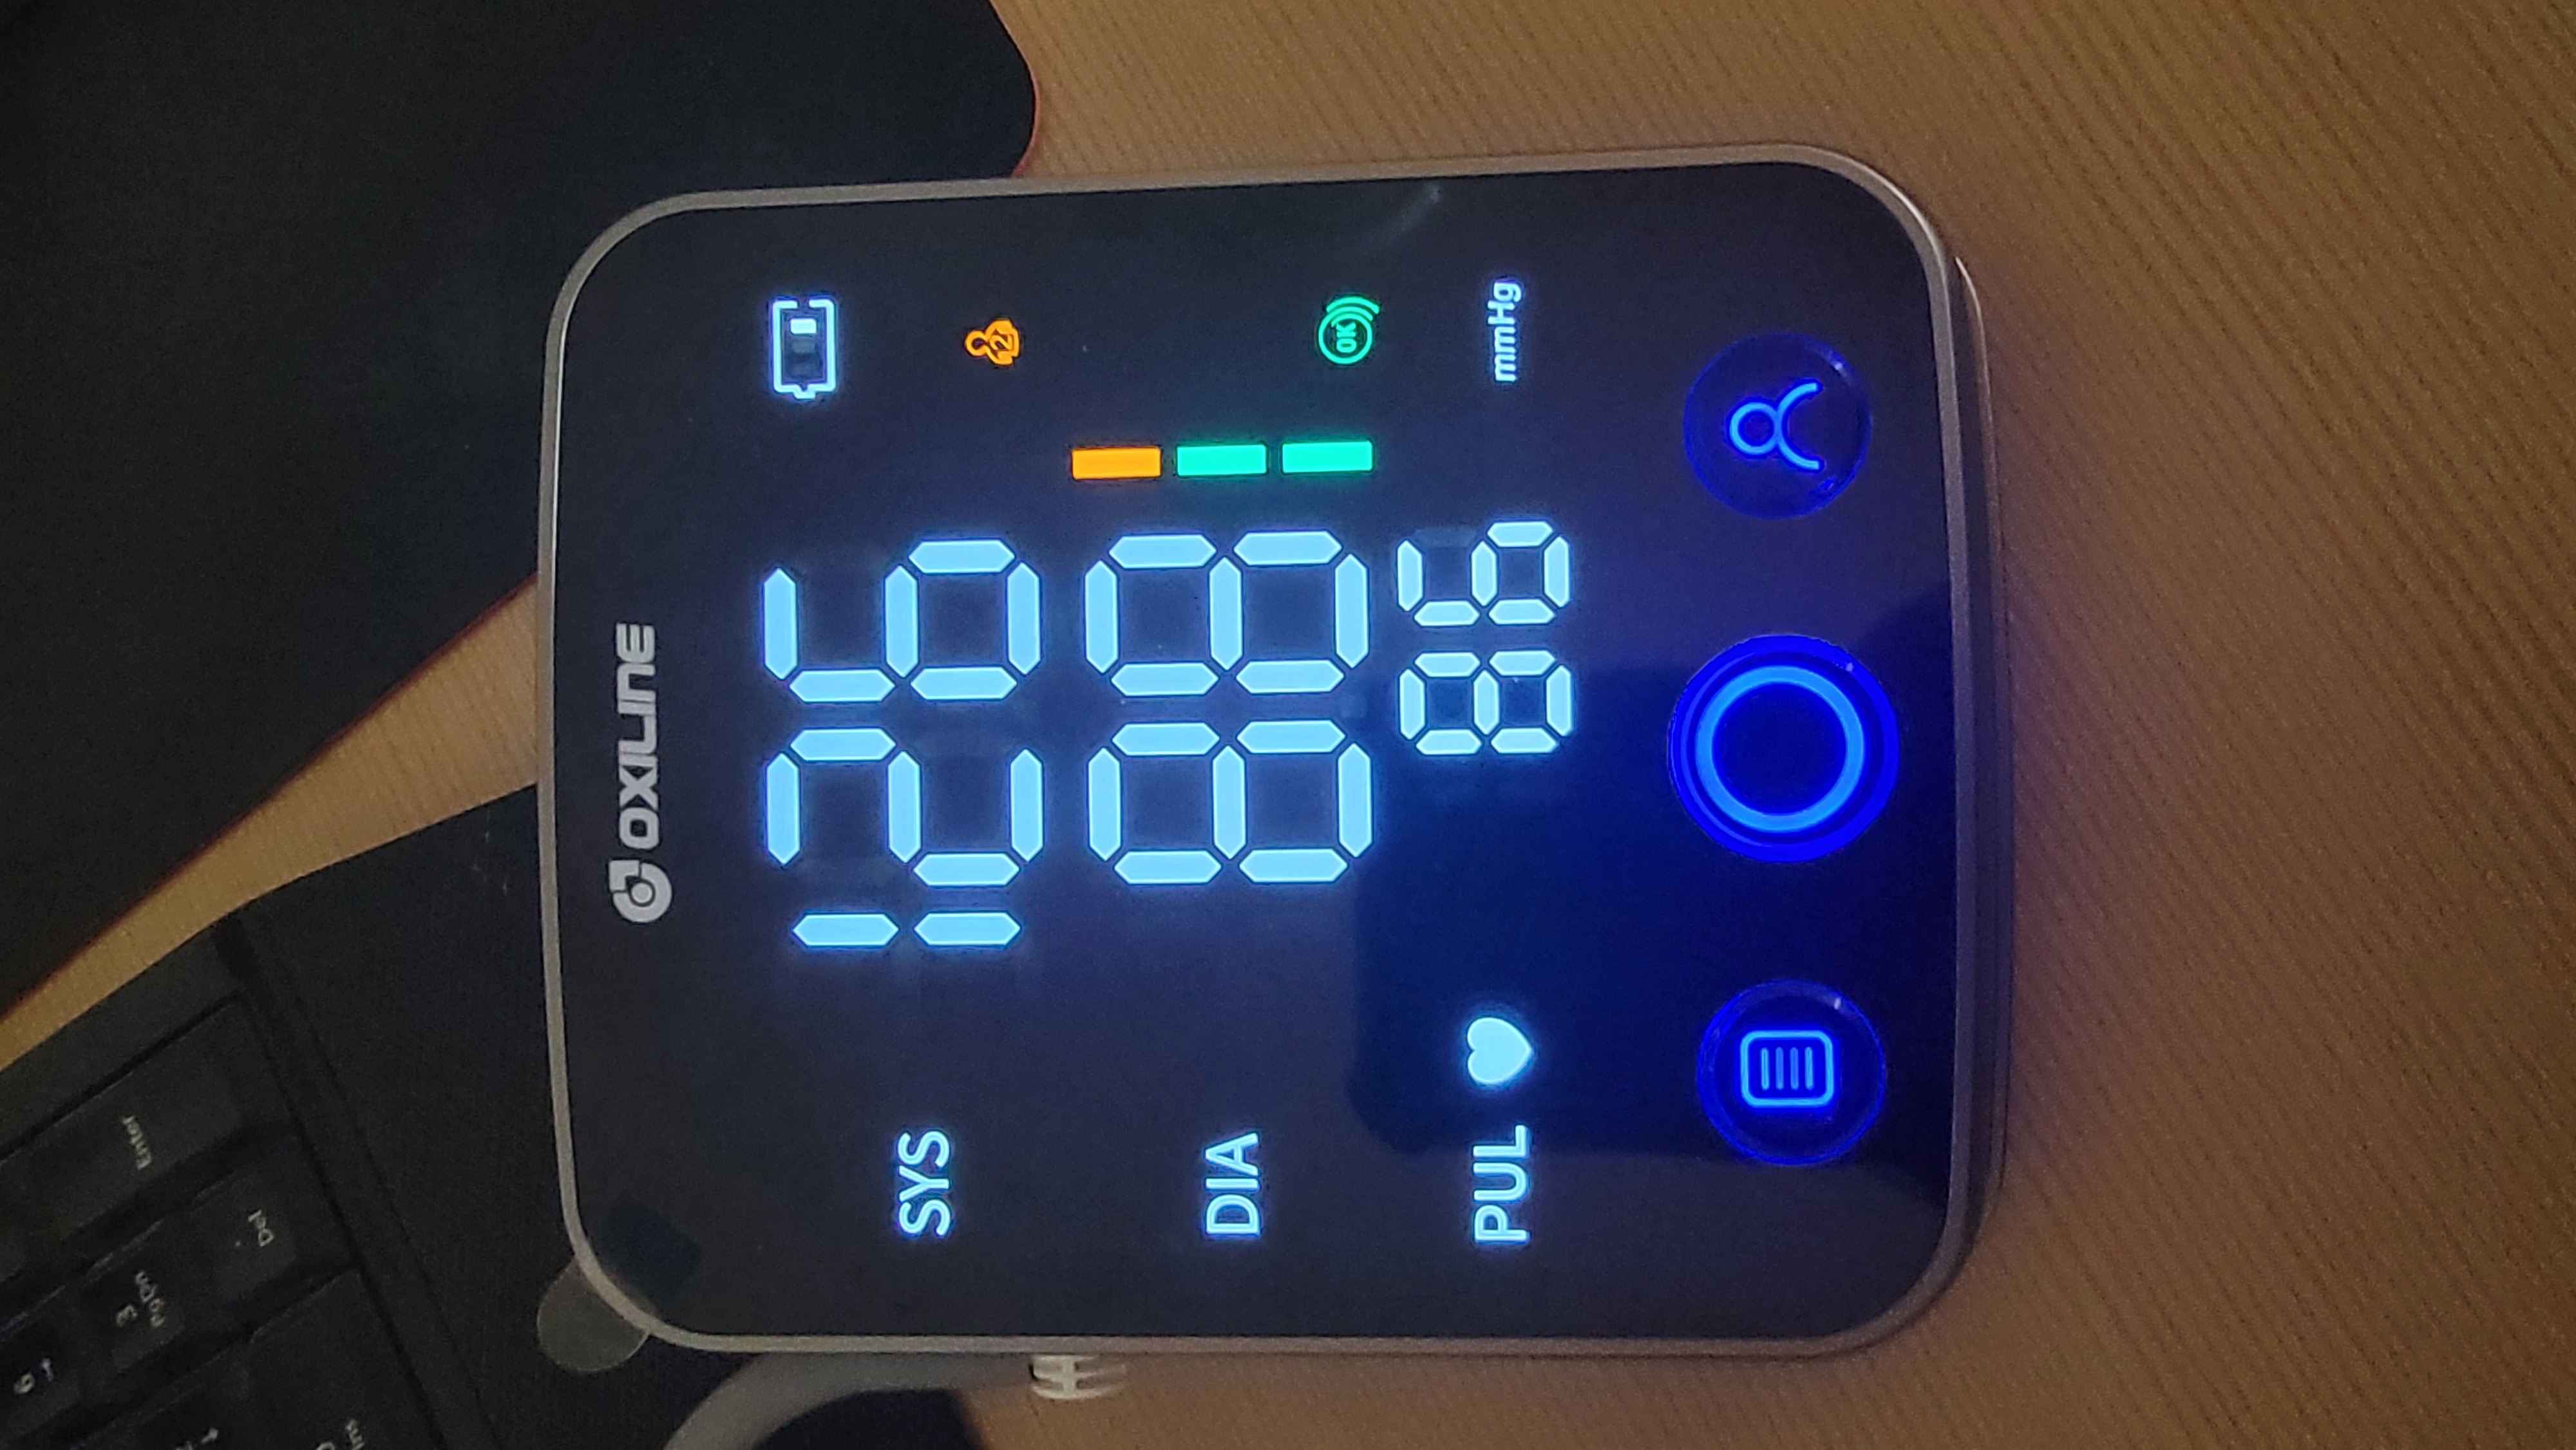
Blood Pressure (Pre vs. Post Run)
Blood Pressure: Pre vs Post
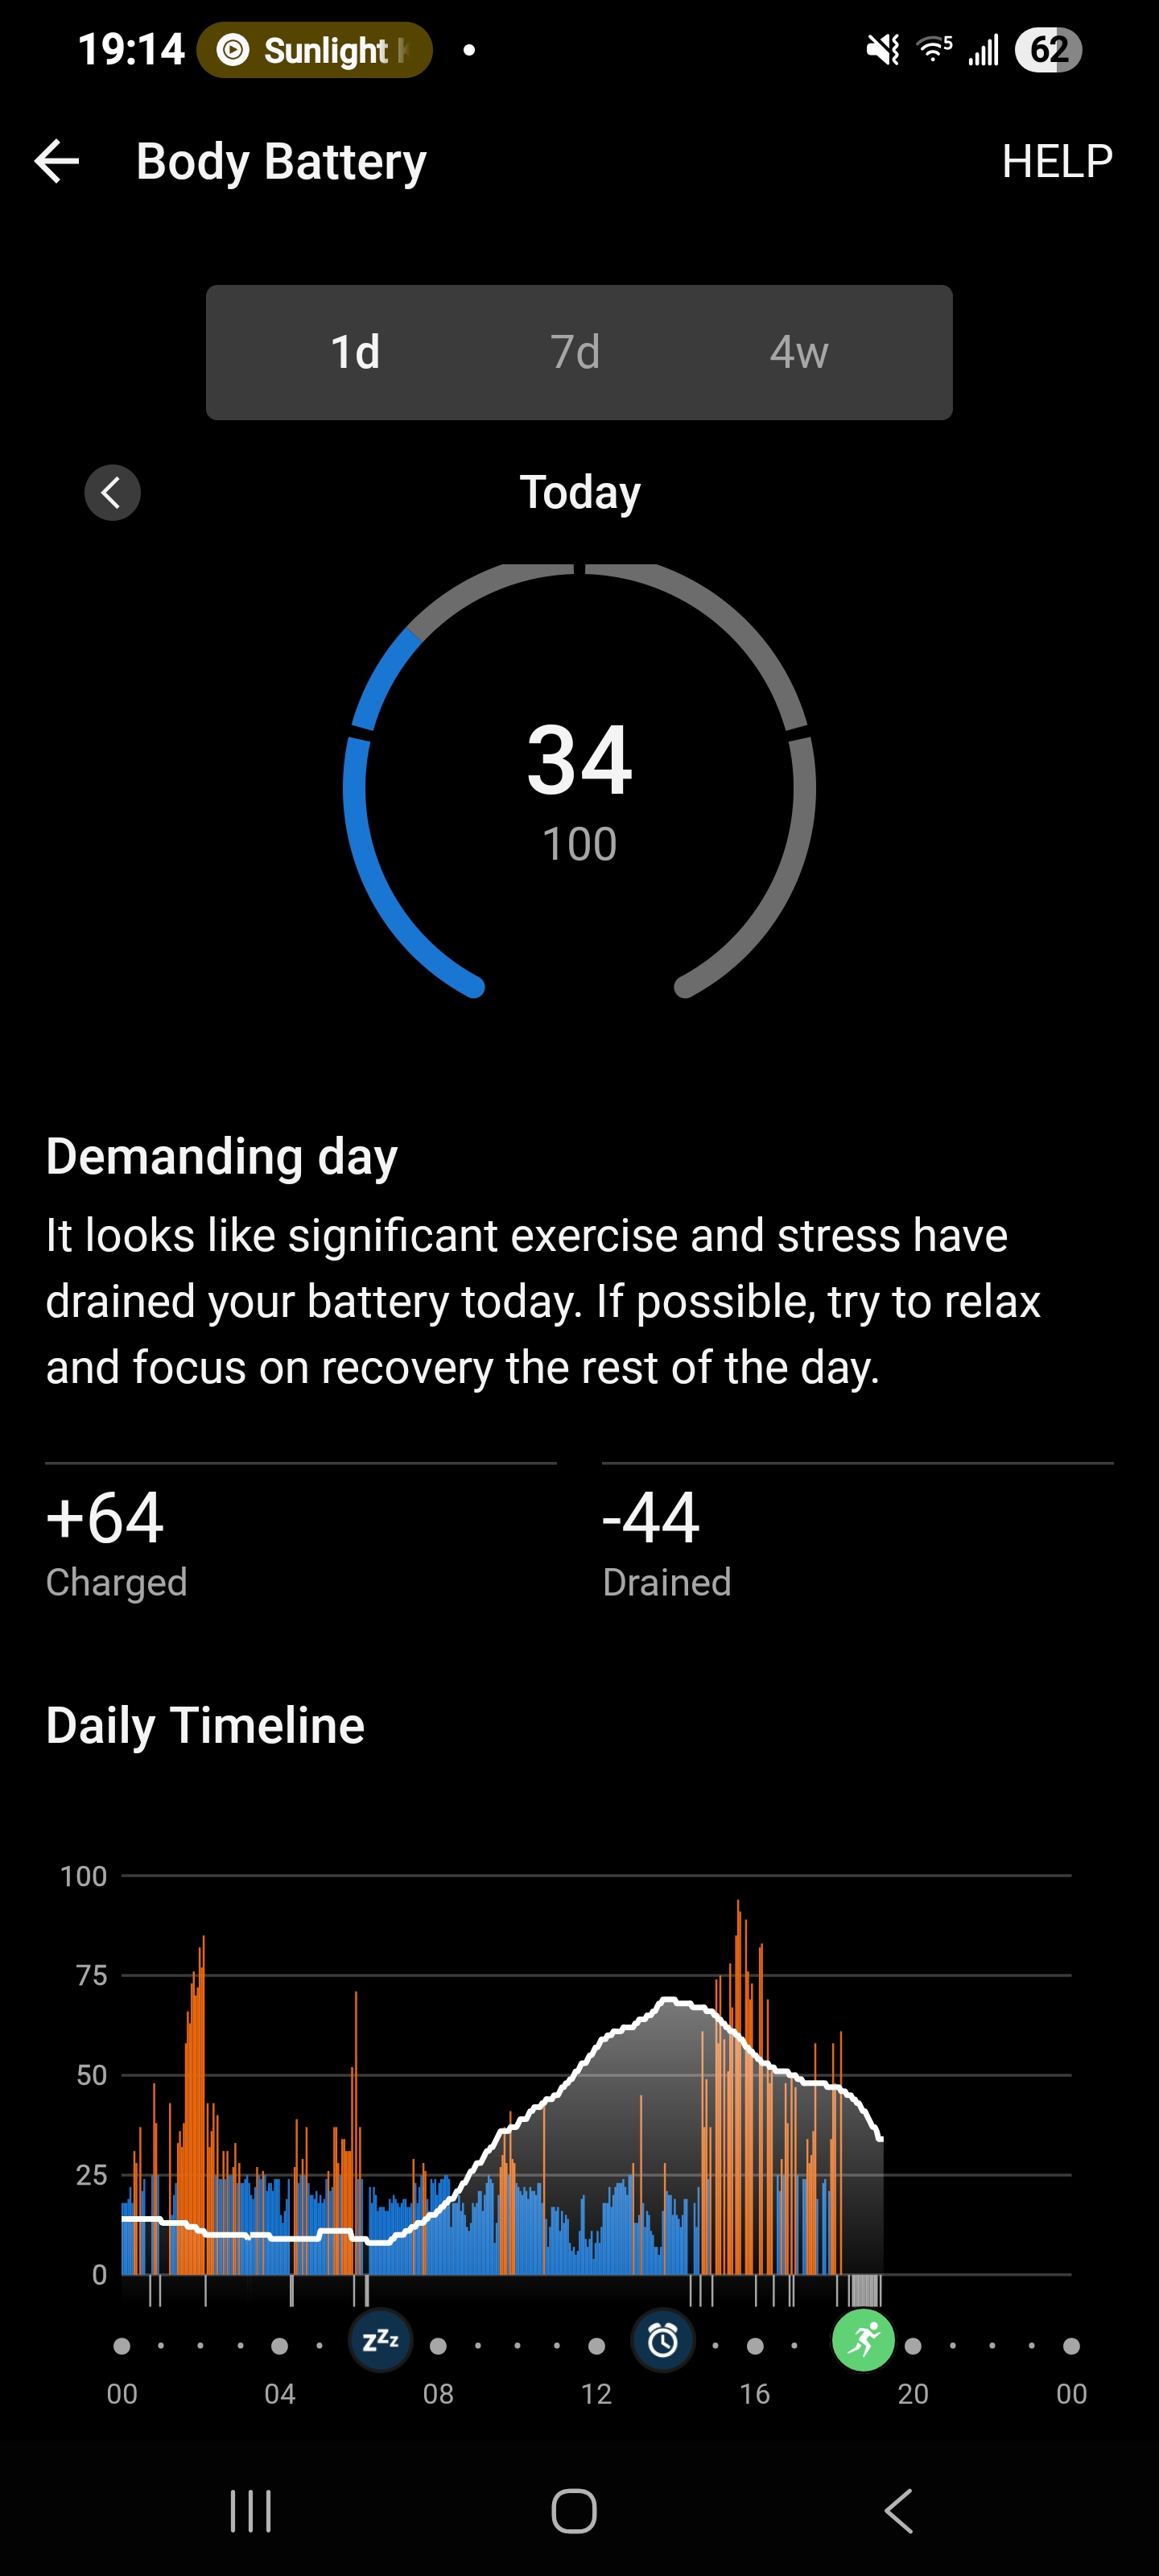
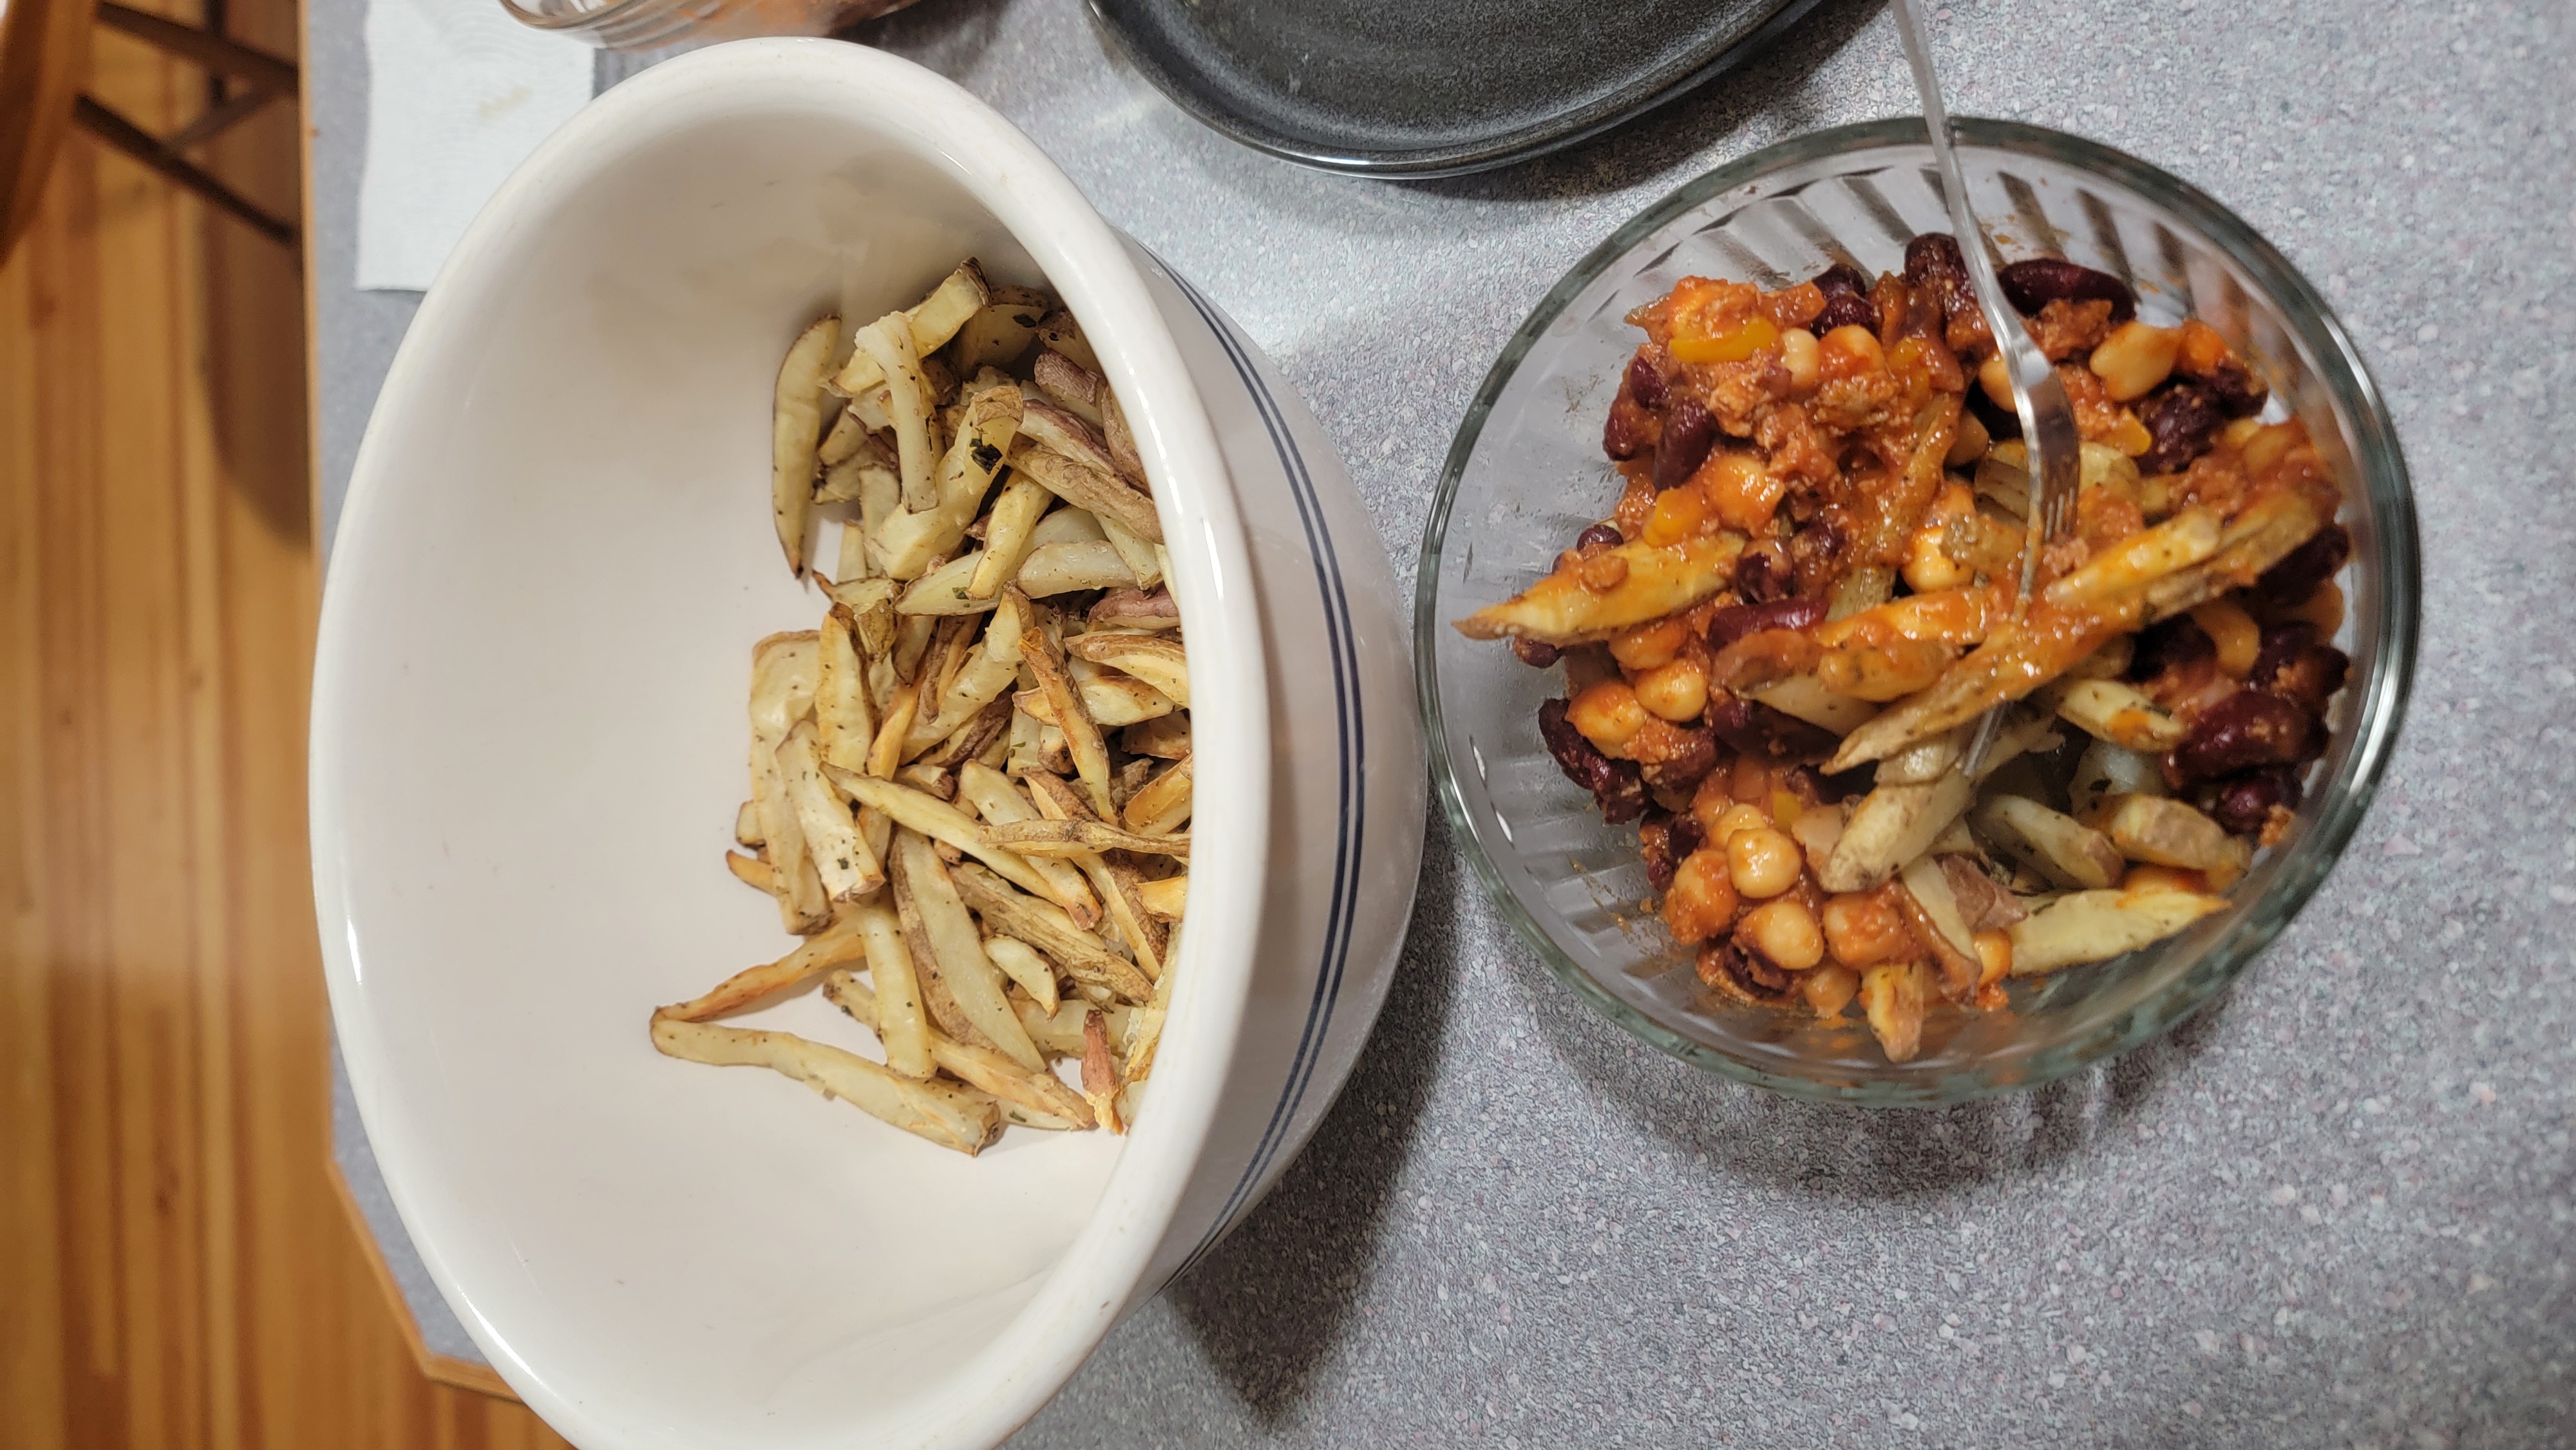
Recovery & Refuel
Recovery Data
This Is What Experimentation Looks Like
You don’t need perfect conditions, optimal protocols, or peak fitness to run experiments and learn from them.
Tracking Stats
This represents workout #867+ in my consecutive tracking streak. Every run is logged. Every data point matters. Even the weird experiments.